Ground Penetrating Radar
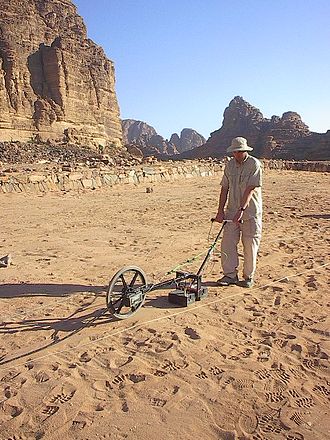
Fig. 84 Archaeological GPR survey in Jordan. Image source .
Ground penetrating radar (GPR) is an electromagnetic method used for very near surface exploration; metres through 10s of metres. It is sometimes referred to as echo-sounding. GPR exploits contrasts in electromagnetic properties in order to define the physical boundaries of shallow structures (both natural and man-made). Physical properties important to GPR include: Dielectric Permittivity, Electrical Conductivity and Magnetic Permeability. Ground penetrating radar is used for a variety of applications. These include:
Investigating concrete structures and roads
Mapping the thickness of peat-bogs and other sedimentary layers
Obtaining the depth to groundwater or permafrost
Locating buried infrastructure such as irrigation pipes, tunnels and electrical wires
Finding land mines and unexploded ordnance
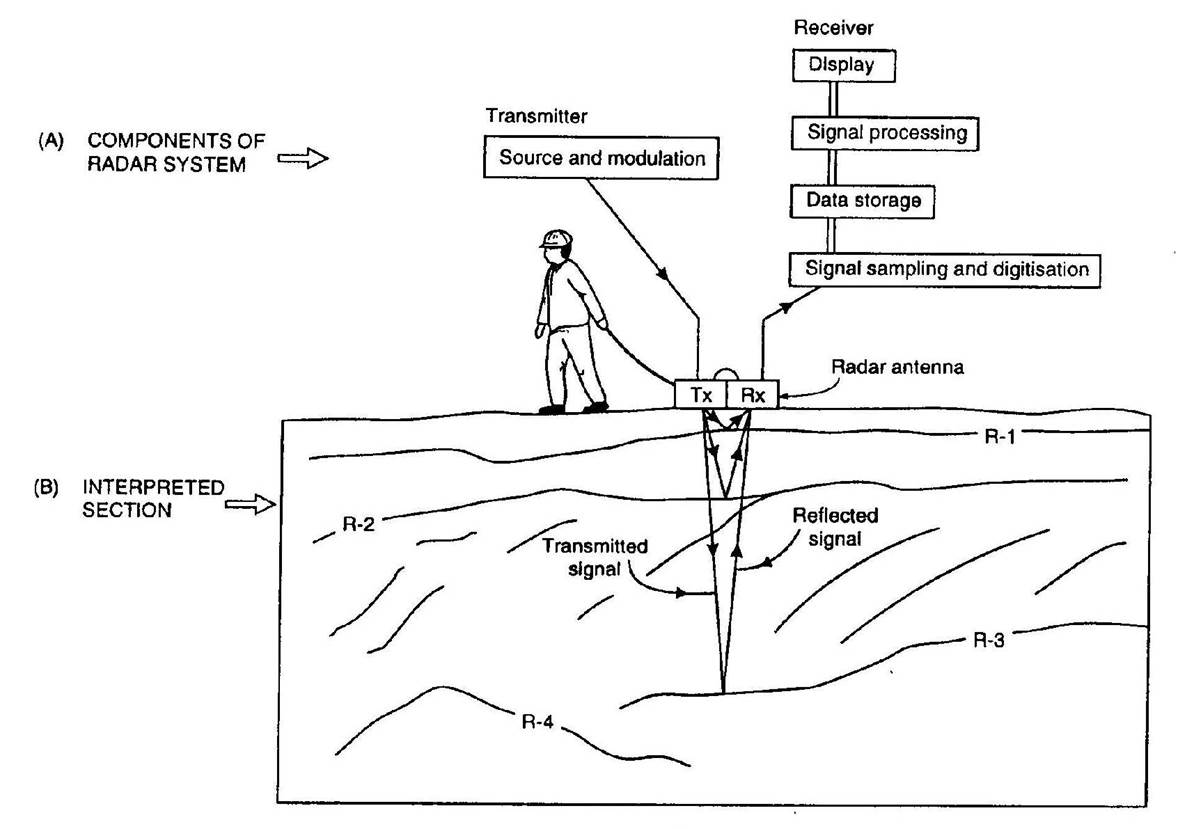
Fig. 85 Schematic of a zero-offset GPR setup.
During GPR surveys, a source (\(Tx\)) is used to send a pulse of high-frequency electromagnetic waves (radiowaves) into the ground. As the radiowaves propagate through the Earth, they are distorted as a result of the Earth’s electromagnetic properties. At boundaries where the subsurface electromagnetic properties change abruptly, radiowave signals may undergo transmission, reflection and/or refraction. Because of this, much of the understanding of seismic methods can be applied to ground penetrating radar.
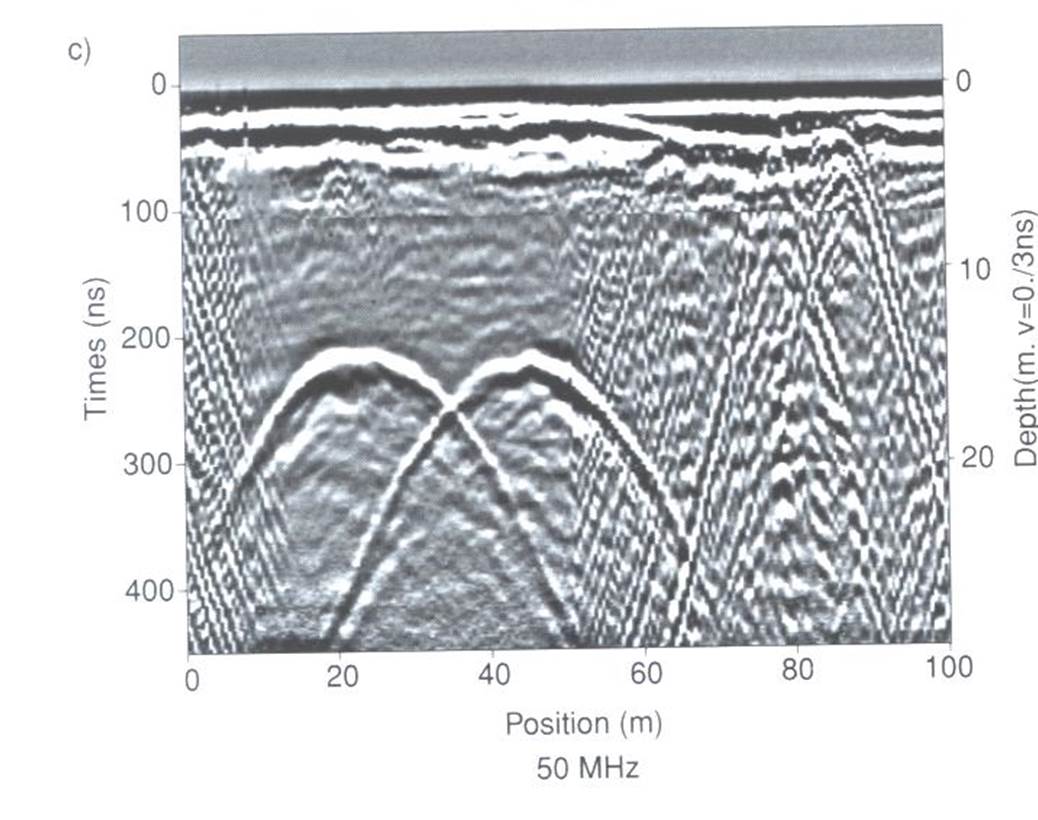
Fig. 86 Radargram example of two underground tunnels (hyperbolas). Gray-scale shows the amplitude of the returning signal.
Sensors (\(Rx\)) at the Earth’s surface measure the amplitudes and travel times of signals returning to the surface. These data from each trace (Tx-Rx pair) are amalgamated and represented using a radargram (similar to a seismogram). The horizontal axis (distance) is used to represent the location of the receiver relative to the source for a particular sounding. The vertical axis shows the travel times of measured signal. By assuming some a-priori knowledge of the radiowave velocity, the vertical axis is sometimes represented by an approximate travel distance. The gray-scale denotes the amplitude of the returning signal at each time and location. It is from radargrams that we will do the majority of our interpretation of GPR data.
Contents